How to optimize waveforms
In our introductory article on inkjet waveforms, we described what waveforms are and how to apply them to the printing head process. Now we are considering how to use a universal ink droplet observation method suitable for many print heads to optimize the waveform for better spraying effects. In this article, we will gradually use the Dimatix Samba print head to provide sample images and data.
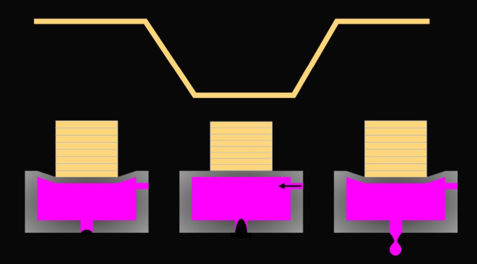
Let's first briefly review the content we discussed in other printheads and waveform articles. In the diagram below, we demonstrate how voltage pulses cause deformation of piezoelectric ceramics, generating pressure in the nozzle chamber and spraying ink droplets. Optimize pulse size, shape, and spacing to ensure that the injection meets our target requirements.
Understand your goals
The first step in any attempt to develop waveforms is to clearly define the goal. Usually, the most important identification targets are the required droplet size, speed, and spray frequency. If you already know the clear target specifications, then you can start directly. If not, some investigation is needed.
If you are an ink company and have specific machines to develop, please confirm the ink usage conditions with your customers. If your customer is an equipment manufacturer, they should tell you all the information you need to know. If sold directly to users, then this information may not be easy to obtain, and you must work harder to find effective and reasonable information. You can understand the working frequency from the print speed and print resolution. Please remember that if printing multiple times, this may differ from the final resolution.
starting point
The first step in waveform optimization is to establish a reasonable baseline for our injection, so that we can use dropwatcher to view it. If possible, a simple approach is to start with the recommended or default single pulse waveform from the printhead manufacturer. In addition to typical pulse timing, there is usually a calibration voltage (sometimes referred to as a "tag" voltage). I started using this because it should generate a reasonable spray. For our Dimatix Samba example, we will start with the waveform in the print head user manual: pulse width 2.18us, amplitude pulse 26V (including 40V/us rise time).
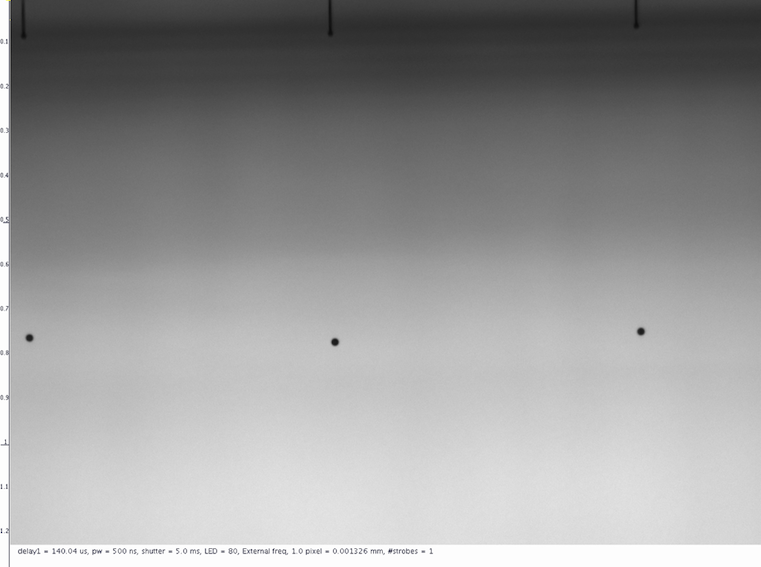
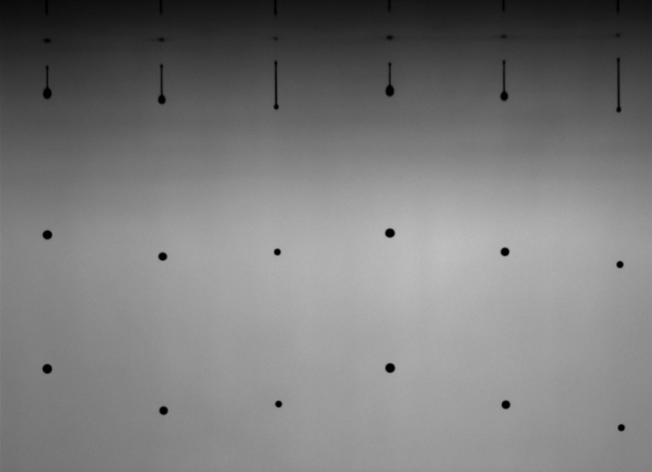
The next step is to make the ink droplets visible in the field of view of the ink viewing instrument. If possible, it is important for you to see the nozzle panel; If you fail, these can also be very helpful in finding the cause of the failure. The following figure provides an ideal view of the Dimatix Samba print head.
If only the syringe is used for initial testing, ink consumption should be minimized to the greatest extent during the testing. Select approximately 10-20 nozzles in the same row of nozzles at a medium frequency of 8kHz for spraying, which can be tested for a period of time without the need for liquid replenishment.
Quickly measure the descent speed to ensure it is reasonable, perhaps 5-6 meters per second. Even if the ultimate goal is higher, this setting can usually be easily measured without too many satellites. If the speed is found to be too slow, it is necessary to slightly increase the pulse voltage, and vice versa. If the speed is acceptable, there is no need to modify the waveform, so 26V is a suitable setting.
Step 1: Optimize pulse width
The first step in optimizing the waveform is to obtain the basic pulse shape to match the acoustic characteristics of the head and fluid combination. In waveform terminology, we will start by determining the appropriate pulse width.
Because the size and fluid properties of the nozzle are fixed, we determine the time to maintain the expansion of the nozzle chamber to allow the ink to move back and forth at a good rhythm.
Generally speaking, there is an approximate quadratic relationship between pulse width and droplet volume and velocity. The optimal pulse width will produce the highest droplet volume and velocity, so finding the peak is our first goal. Determine the current pulse width of the starting waveform and plan to adjust the pulse width from 50% below the recommended setting to 50% above the recommended setting. Measure the droplet volume and velocity at a consistent distance from the print head at each pulse width. Choose an appropriate interval and provide a few data points to establish a curve.
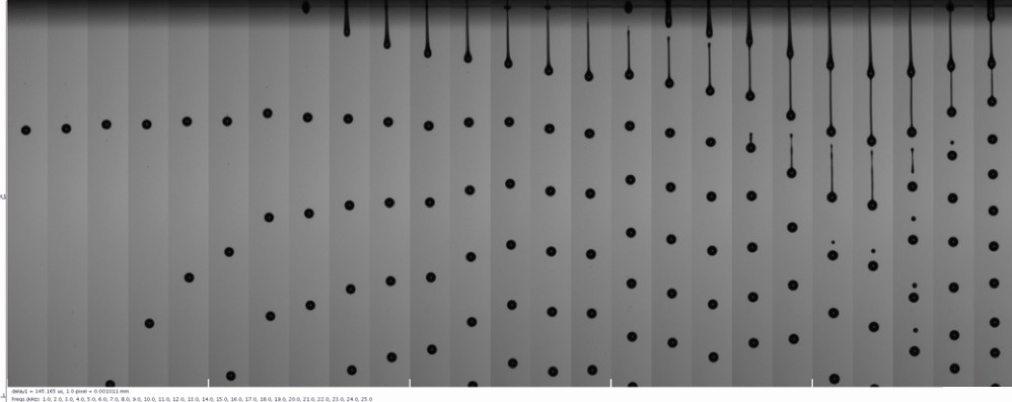
For our Samba print head, we will automatically scan pulse widths from 1.1 microseconds to 3.3 microseconds in increments of 0.1 microseconds. By capturing images at each value (using dual pulses), we can quickly determine the speed of the fall and supplement measurement values as needed. The following figure is generated using a combination of XSweep and Stitch. XSweep and stitching
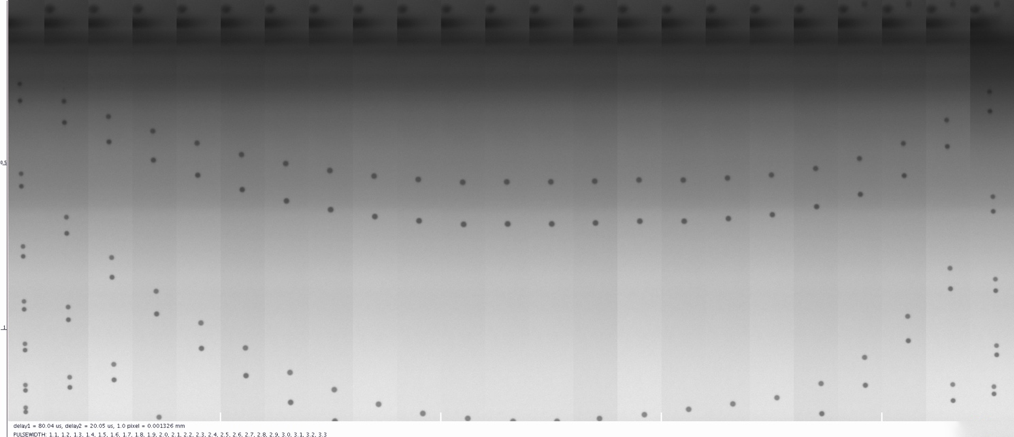
The top of the speed curve is the position where pulse timing provides the most effective ink droplet injection for the combination of ink, nozzle, and electronic devices. Sometimes it is necessary to use a pulse width slightly higher than the peak value, as it can reduce the satellite. Gaining some experience will help you make this decision. Once you have selected your pulse width, program the value into your waveform and proceed to the next step.
According to our image, it can be seen that the pulse width of 2.1-2.2 microseconds appears to produce the highest droplet velocity. We can distinguish because each piece of the image was taken at the same time, and the ink droplets are farthest from the print head among these pieces. If you remember, 2.18us is our starting pulse width in the Dimatix Samba manual, and in fact, it seems to be the best. Well done, Dimatix!
Save time
Just like most settings in inkjet printing, users can decide the accuracy of the processing process on their own. In the case of waveform optimization, choosing smaller intervals to test each parameter will give you more accurate results. However, when manually conducting such analysis, smaller intervals mean an increase in the time required for conducting such tests. To speed up the process, ImageXpert has a tool called XSweep, which automatically adjusts waveform settings and performs measurements for you。
Step 2: Optimize voltage
Now that we have determined the correct time, we can explore the relationship between voltage, drop volume, and speed. Usually, there is a linear relationship between voltage and droplet volume and velocity until the limit is reached. The increased voltage will also produce increased ligaments, so the goal is to achieve the highest possible speed and produce a beautiful and clean water droplet without tailing the satellite.
As we previously determined the pulse width, let's try a series of voltages and measure the droplet velocity at each voltage. It is also important to pay attention to the volume of ink droplets and satellite formation, as this can affect our decision-making. At this point, the goal is to determine the voltage setting and provide us with the target volume and speed without too many satellites. With Samba, we will automatically scan the voltage from 21V to 31V in increments of 0.5V. The output is as follows。

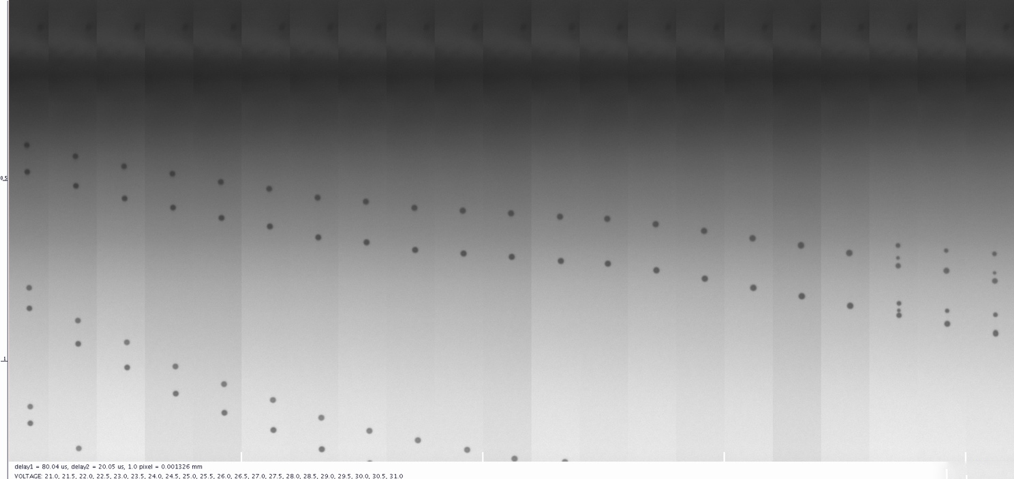
The result seems to be consistent with the theory once again. The droplet velocity increases linearly with voltage until the satellite point is introduced. Therefore, choose a voltage slightly lower than the voltage that generates the satellite for measurement。
We now know the volume and velocity of droplets generated by using these waveform settings, which can be compared with our target. But our work is not yet completed。
Step 3: Increase printing frequency
Now that you have improved the pulse and achieved the expected speed, increase the frequency for printing. This will test whether the waveform we have constructed so far performs well at the target frequency and whether there are any specific points that need to be avoided. If you already know the key target frequency, you can save some time by watching the jet there, but don't forget that it also includes subharmonics. This ensures that if you adjust the ink drop spacing during the rendering and printing of images, your waveform will still perform well。

We believe it is usually best to understand the entire frequency space as much as possible. You have set up the system and you never know when the customer will request to use the ink at another frequency. In addition to XSweep, Imagexpert also provides frequency scanning add-on components to help speed up the process. This will automatically
Scan a series of frequencies and collect data, which is particularly useful for higher frequency print heads. The following figure shows the Samba waveform of our jet at 1-30 kHz with a step size of 1 kHz。
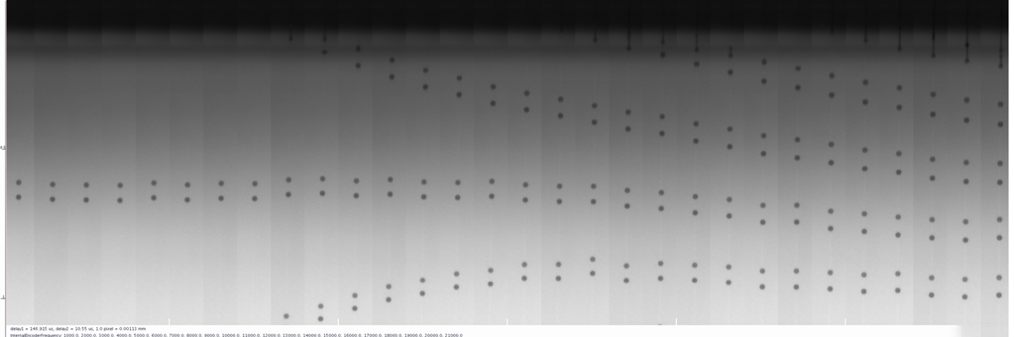
Fortunately, our printing performance looks quite good within this range. Here is another example that tells a different story。
Pay attention to how the injection is carried out at a constant speed until about 19 kHz, and then the speed increases sharply? In addition to an increase in speed, we also see an increase in ligament length and satellite point formation. If you recall our previous waveform article, this is resonance at work. At 19-24 kHz, at this printing frequency, the pulse is amplified by the retention momentum of the previous pulse in the nozzle. With this knowledge, you can modify the design of the system to avoid this frequency or use different waveforms for that range.
What if the result is not good?
If the waveform you create performs poorly at the target frequency, select a lower voltage and try again. This is an iterative process, and you may need to make small changes to the pulse width and voltage, and then repeat it to obtain the desired result. This is where automation comes in handy. If you seem unable to make your droplet volume or velocity high enough, multiple pulses may be helpful.
Step 4: Introduce multiple pulses
When multiple pulses are used in the waveform to generate droplets, we call it multiple pulses. Don't confuse this with grayscale; We still only generate one droplet size and only use multiple waveform pulses to achieve it. If a single pulse cannot spray enough ink, multiple pulses are useful for increasing the volume of ink droplets being sprayed.

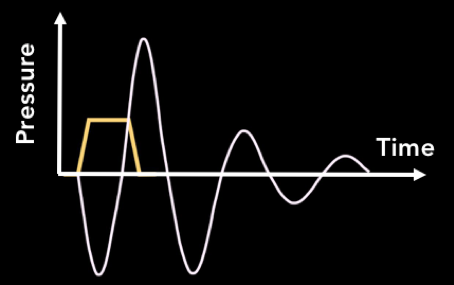
If we want to use multiple pulses to generate larger ink droplets, we must start by understanding the basic time the ink moves in the print head. We achieve this by generating two identical pulses and observing what happens during the injection based on the gap between them, as shown below. When the timing is appropriate, the momentum of ink in the nozzle will increase due to the second pulse, and once sprayed out, we will see a faster decrease.

Let's copy the optimization pulse we created earlier and adjust the spacing between these two pulses to analyze the injection at each step. A good starting point is to change the interval from the minimum allowable value to twice the width of each pulse. The best measurement method is to observe the velocity of the second droplet flowing out (if any), as the velocity of this droplet is highly sensitive to pressure fluctuations caused by the first pulse. In some low pulse gaps of head/ink combinations, droplets are likely to merge before you have the opportunity to measure them, while in other cases, the second jet may appear as a protrusion on the first ligament. The important thing is to find out at what intervals you can measure the fastest descent rate. Most successful grayscale waveforms work within or near the resonance period, so jetting is optimal for a given input quantity.
When we replicated our optimized Samba pulse and scanned the pulse interval from 1.4 microseconds to 3.2 microseconds in steps of 0.1 microseconds, we generated the following image. It is obvious that the speed of the second descent is the highest, which is our resonance period.
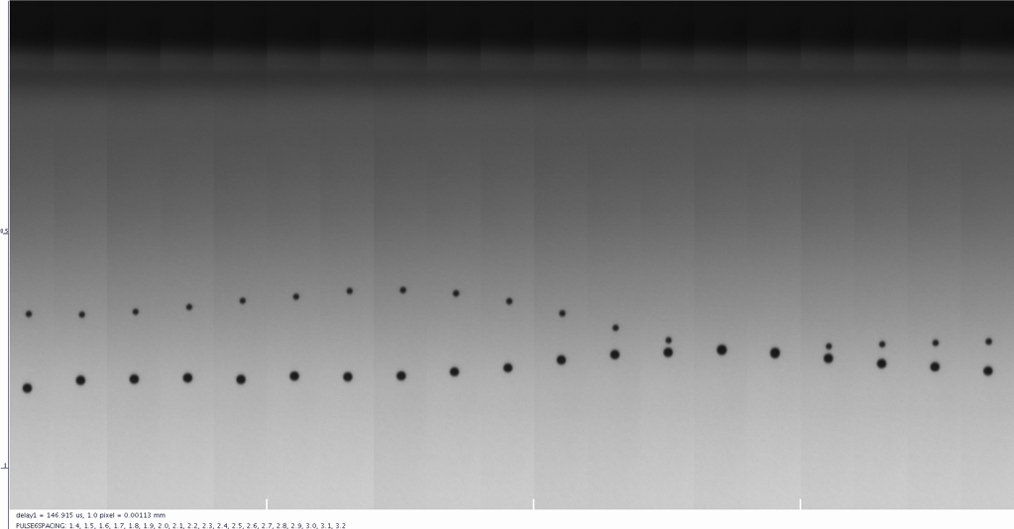
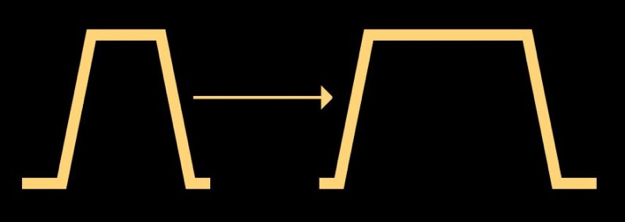
Now that we know the resonance period, we can establish a waveform that uses it. The only thing to remember is that if you want to stack pulses one after another like this, it is important to consider the voltage amplitude, otherwise you will push the final injection speed very high. As we have discussed before, this is usually a bad thing for nozzle wetting and satellite points. Therefore, considering this, you can start from these to obtain your target droplet size.
Create multi pulse grayscale
As we have already mentioned, the main difference in grayscale is the ability to change the ink droplet size of each pixel on the printed image. This means that you need to choose the waveform pulse to use for each grayscale level to obtain the desired droplet size. The first step in achieving this is to divide the waveform into segments that can be selected by the printing controller. Then, you must associate the correct line segment with the grayscale.
Just like the pulse shape itself, this part is very dependent on your system, especially the software that allows you to edit the shape of the waveform. The simplest visualization method is to draw waveforms with delimiters and then use a table to tell you which one to use for each level, which is often used in patents. We have drawn an example of 5 pulses below.
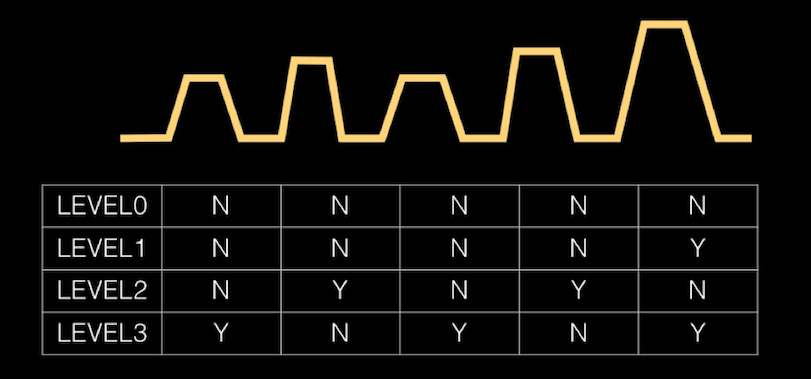
We chose level 3 with 5 pulses because it demonstrates the potential for high flexibility, including the pulse not having to be the same or the amplitude being linear (as in our first example). It should be remembered that regardless of the grayscale level you choose, the maximum frequency is the reciprocal of the time required to complete the entire waveform.
There are usually some rules related to the distance between pulses, so that the electronic board has time to switch between waveform segments. Most good waveform editors will tell you if there will be any issues.
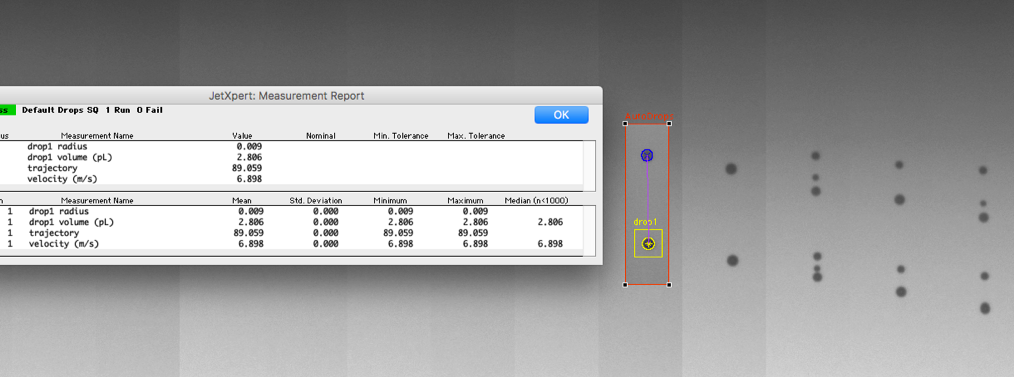
Now, you can adjust the pulse width, voltage, and pulse interval of individual waveform segments to obtain droplet volume and velocity that match the target. It is useful to place water droplets of different sizes side by side in the same field of view, so that you can study the impact of changes on all grayscale levels. The image displays three different grayscale levels in one field of view.
Advanced waveform design
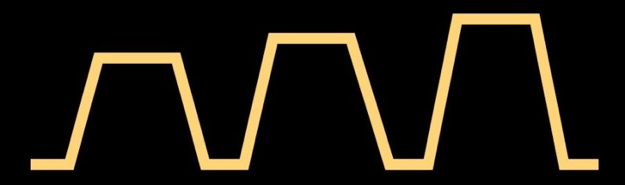
For example, the multi pulse method can also be used to control nozzle plate wetting or affect ligament rupture. As shown below, additional pulses can appear before or after the main jet pulse. The techniques for implementing more advanced waveform techniques are difficult to systematize, but we want to ensure that you know these things are possible.
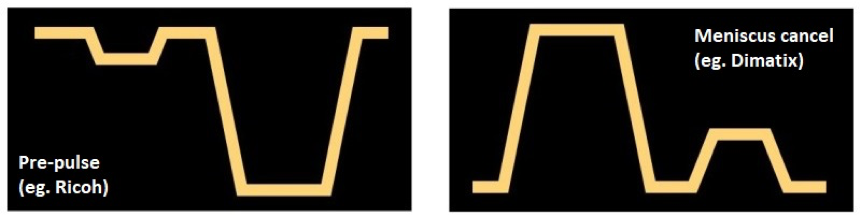
There is also a method that some leading manufacturers use as a standard, called bipolar pulse. This term comes from a nozzle that uses positive and negative amplifiers to drive piezoelectric ceramics in two directions. The advantage of this system is that it can achieve more effective droplet injection from a lower total voltage, but it also allows programming of pulses in any direction to control pressure changes after injection. Due to the bipolar capability making electronic devices more complex, a unipolar circuit (with only positive or negative voltage) can be used to reconstruct this effect, which uses non-zero residual voltage. We are trying to explain this difference using the following image, which is taken from several recent patents of two major nozzle manufacturers. The image on the left is a bipolar waveform, while the image on the right is a unipolar waveform with non-zero residual voltage.
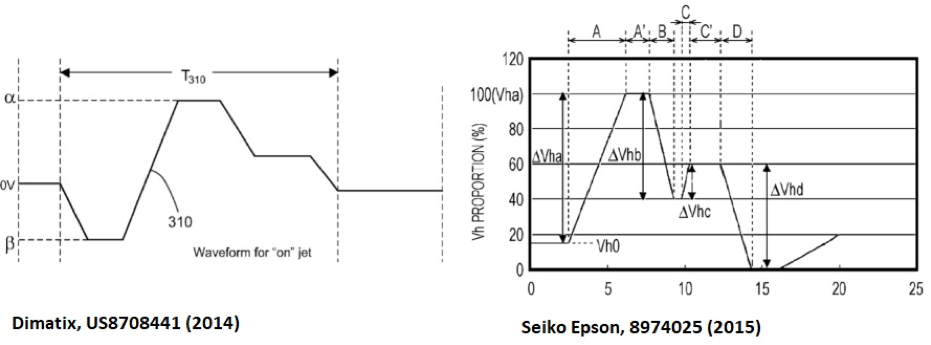
In both cases, the waveform is not just a series of simple trapezoids as we previously described. Generating more arbitrary shapes requires a different method, not just the height and width of the pulse. Usually, a waveform is defined by the segment of time that changes from one voltage to another within a given time. We need some specific electronic devices, which may be supplier specific. The use of these techniques to optimize waveforms may be elaborated on in future articles.
Conversation with representatives
16th Building F2, Yuefu Avenue, Liangjiang New Area, Chongqing

© 2024 All rights reserved by Inkjet Research Institute. All rights reserved。渝ICP备2022008663号-1
